Table of Contents
Introduction
Many times, the code we write requires optimizations, and profiling helps us find the problematic sections of code, investing the least amount of work on fixing the issue, while aiming for the goal of gaining speed and reducing resource consumption.
We can profile any resource, not just CPU and memory, but also parameters like bandwidth and I/O storage speed rates.
It is important to differentiate between a piece of code that you think may be the bottleneck, and what profiling can help us to hypothesize as the root of the problem. This is important to understand, because it is what determines the saving of effort in finding an optimal solution.
The first thing is to identify what causes the bottleneck, in order to extract a test case and isolate the section of the system that needs to be tested.
Time Profiling Tools
functools.wraps
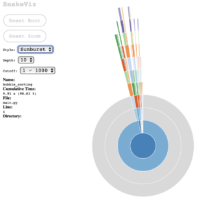
Sorting algorithms are great test cases to evaluate performance. As for profiling time, the most common way to do this is using print, it works fine but soon becomes unmanageable when trying to identify where we should write print statements to evaluate time, but it is useful for quick evaluations.
A slightly cleaner approach is using decorators, as in the following example:
import time
import numpy as np
from functools import wraps


def measuring_time(fn):
    @wraps(fn)
    def wrapper(*args, **kwargs):
        t1 = time.time()
        result = fn(*args, **kwargs)
        t2 = time.time()
        print(f'@measuring_time: {fn.__name__} :: {t2 - t1} seconds.')
        return result
    return wrapper


@measuring_time
def bubble_sorting(array):
    n = len(array)

    for i in range(n):
        sorted_item = True

        for j in range(n - i - 1):
            if array[j] > array[j + 1]:
                array[j], array[j + 1] = array[j + 1], array[j]
                sorted_item = False

        if sorted_item:
            break

    return array


work_array = np.random.randint(1, 100000, size=10000)
bubble_sorting(work_array)

>>>> @measuring_time: bubble_sorting :: 9.98324704170227 seconds.
timeit module
timeit module is another tool for timing the execution of a process, expressed in seconds. It is most useful with simple expressions, but it can be used with the above example via the Python interface (as shown below), or via a Python script:
In [1]: import timeit
In [2]: s = """\
   ...: import numpy as np
   ...: def bubble_sorting(array):
   ...:     n = len(array)
   ...:     for i in range(n):
   ...:         sorted_item = True
   ...:         for j in range(n - i - 1):
   ...:             if array[j] > array[j + 1]:
   ...:                 array[j], array[j + 1] = array[j + 1], array[j]
   ...:                 sorted_item = False
   ...:         if sorted_item:
   ...:             break
   ...:     return array
   ...: work_array = np.random.randint(1, 100000, size=10000)
   ...: bubble_sorting(work_array)
   ...: """
In [3]: timeit.timeit(stmt=s, number=1)
Out[3]: 9.969992417000014
It is important to mention what the official timeit documentation says, regarding the garbage collector:
By default,
timeit — Measure execution time of small code snippetstimeit()temporarily turns off garbage collection during the timing… The disadvantage is that GC may be an important component of the performance of the function being measured. If so, GC can be re-enabled as the first statement in the setup string…
If the parameter number is not specified, timeit will execute the instruction for 1 million iterations, so it’s better to specify the number of times you want to execute the instruction, and keeping a benchmark of the results.
In [4]: timeit.timeit(stmt=s, number=10)
Out[4]: 99.57917050000015
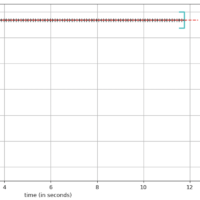
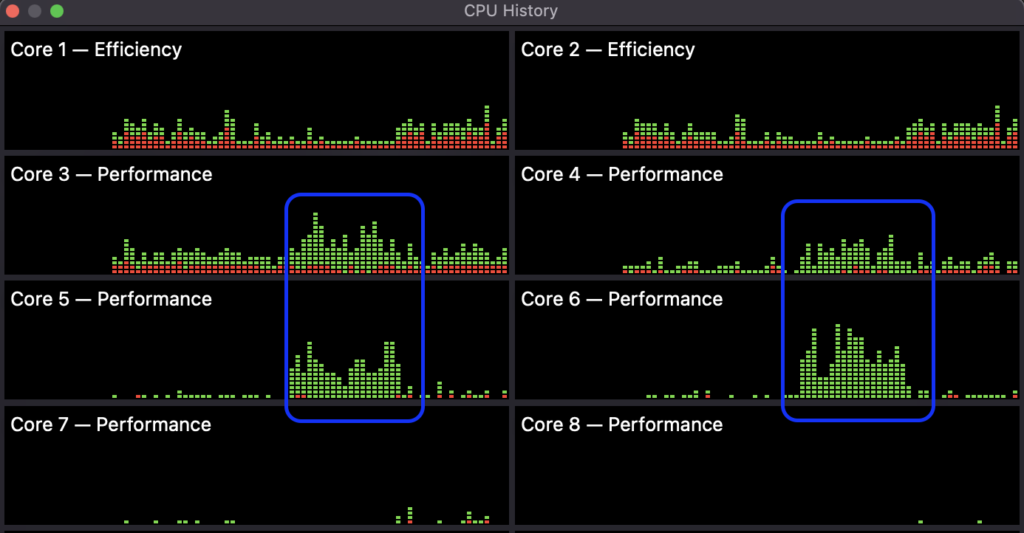
It worths considering the variation in the load with which the process will be executed in normal and edge conditions, since that is going to affect the CPU and memory consumption. The system resource monitor can help us observe the variation in resource consumption:
time / gtime
You can use the Unix-like systems time command (gtime for MacOS, install it with brew install gnu-time), which is not Python-specific.
alexis@MacBook-Pro % gtime -p python main.py
@measuring_time: bubble_sorting :: 9.93534517288208 seconds.
real 10.02
user 10.31
sys 0.08
The -p flag returns the following results. These results indicate the time consumed inside de function (real), the total time including timing (user), and the time spent in kernel-level functions (sys).
alexis@MacBook-Pro % gtime --verbose python main.py
@measuring_time: bubble_sorting :: 9.969091176986694 seconds.
        Command being timed: "python main.py"
        User time (seconds): 10.34
        System time (seconds): 0.09
        Percent of CPU this job got: 103%
        Elapsed (wall clock) time (h:mm:ss or m:ss): 0:10.09
        Average shared text size (kbytes): 0
        Average unshared data size (kbytes): 0
        Average stack size (kbytes): 0
        Average total size (kbytes): 0
        Maximum resident set size (kbytes): 27728
        Average resident set size (kbytes): 0
        Major (requiring I/O) page faults: 449
        Minor (reclaiming a frame) page faults: 1604
        Voluntary context switches: 122
        Involuntary context switches: 1034
        Swaps: 0
        File system inputs: 0
        File system outputs: 0
        Socket messages sent: 0
        Socket messages received: 0
        Signals delivered: 0
        Page size (bytes): 16384
        Exit status: 0
The option –verbose will show more detailed information about the metrics occurring during the process execution.
Conclusion
Time measurement tools used during the execution of a process can give us an idea not only of the execution time, but depending on the test cases used to perform these measurements, they can give us an idea of the performance of the algorithms, and check if the used workload in the test cases may be causing bottlenecks.
Additionally, they can be a metric for the Big-O notation classification of the algorithm.
If you think this content was helpful, consider buy me a cup of coffee. 😉 ☕👉