Table of Contents
memory_profiler
Similar to line_profiler, memory_profiler provides detailed memory usage measurements, with the aim of efficiently reducing memory consumption and optimizing memory usage to improve application performance..
⚠️ Before starting using this tool, it is important to mention the impact on the execution speed of the code while it is in use, since the execution time increases dozens of times, it is convenient to profiling time and CPU beforehand, and use line_profiler only on sections identified to be optimized.
As with line_profiler, the @profile decorator indicates the method to be evaluated.
However, analyzing the memory usage in Python is complicated, even if we consider that the garbage collector is freeing memory, we do not know for sure when a section of memory is freed and when an object is going to be released, or how long it will remain in the pool until it is finally disposed. Many times, it is convenient to handle methods that consume more memory, and not repeatedly allocate memory because it is an expensive process, and it is more efficient than analyzing the memory usage of the code line by line.
Using the sorting algorithm as an experiment, we perform the following exercise:
import numpy as np

@profile
def bubble_sorting(array):
    n = len(array)

    for i in range(n):
        sorted_item = True

        for j in range(n - i - 1):
            if array[j] > array[j + 1]:
                array[j], array[j + 1] = array[j + 1], array[j]
                sorted_item = False

        if sorted_item:
            break

    return array


work_array = np.random.randint(1, 100000, size=10000)
bubble_sorting(work_array)
In the following instruction, I use gtime -p along with memory_profiler to measure the execution time, but it is not required.
alexis@MacBook-Pro % gtime -p python -m memory_profiler main.py

Filename: main.py

Line #    Mem usage    Increment  Occurrences   Line Contents
=============================================================
     3   56.859 MiB   56.859 MiB           1   @profile
     4                                         def bubble_sorting(array):
     5   56.859 MiB    0.000 MiB           1       n = len(array)
     6
     7   56.906 MiB -254060.531 MiB        9909       for i in range(n):
     8   56.906 MiB -254060.531 MiB        9909           sorted_item = True
     9
    10   56.906 MiB -874942713.984 MiB    50000814           for j in range(n - i - 1):
    11   56.906 MiB -874688626.062 MiB    49990905               if array[j] > array[j + 1]:
    12   56.906 MiB -287907579.547 MiB    25155548                   array[j], array[j + 1] = array[j + 1], array[j]
    13   56.906 MiB -287907586.656 MiB    25155548                   sorted_item = False
    14
    15   56.906 MiB -254101.422 MiB        9909           if sorted_item:
    16   16.016 MiB  -40.891 MiB           1               break
    17
    18   16.016 MiB    0.000 MiB           1       return array

real 1855.21
user 1046.50
sys 808.82
There are two important things to note here: first, the output of memory_profiler is very detailed line by line, which is what we are looking for when using this tool; and, second, the elapsed time is approximately 30 minutes, which is a considerable time compared to the original time (~10 seconds). These metrics should give us an indication of how and when to use this tool.
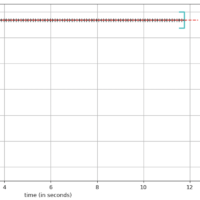
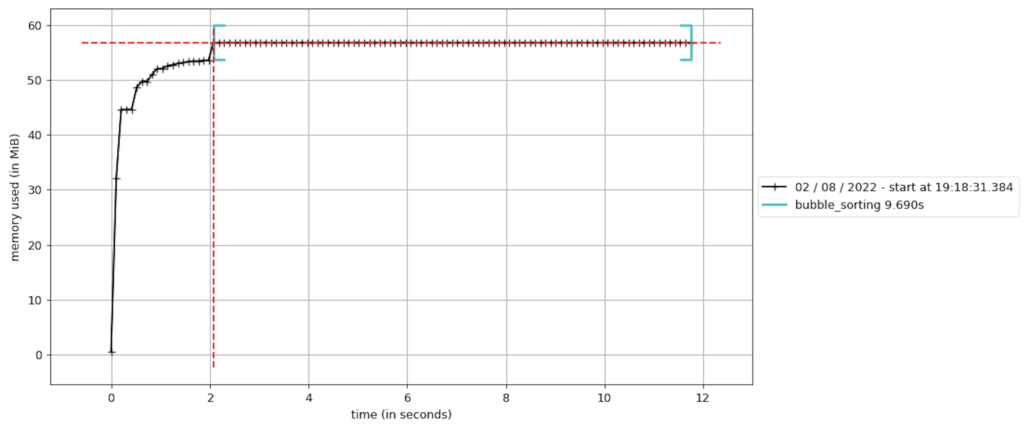
memory_profiler includes the mprof command (requires matplotlib to be installed), which allows you to visualize changes in memory usage, for example:
alexis@MacBook-Pro PythonProfiling % mprof run main.py

mprof: Sampling memory every 0.1s
running new process
running as a Python program...
alexis@MacBook-Pro PythonProfiling % mprof plot
Using last profile data.
PySpy
PySpy is a great tool that helps us to evaluate processes that are already running, without the need to stop and configure them beforehand. For this reason, it requires additional privileges to evaluate other processes. It is especially useful for running experiments in environments such as Production or UAT.
The py-spy package must be installed with PIP or Conda, depending on the local Python installation, and the command it includes is py-spy. To evaluate a running process it is important to obtain the Process Identifier (PID), for example:
alexis@MacBook-Pro % ps -A

  PID TTY           TIME CMD
...
36588 ??         0:51.08 /Users/alexis/miniforge3/bin/python /Users/alexis/PythonProfiling/main.py
...
C:\Users\alexis>tasklist

Image Name                     PID Session Name        Session#    Mem Usage
========================= ======== ================ =========== ============
...
python3.10.exe               18212 Console                    1     47,460 K
...
PySpy has 4 subcommands:
USAGE:
    py-spy <SUBCOMMAND>

OPTIONS:
    -h, --help       Prints help information
    -V, --version    Prints version information

SUBCOMMANDS:
    record    Records stack trace information to a flamegraph, speedscope or raw file
    top       Displays a top like view of functions consuming CPU
    dump      Dumps stack traces for a target program to stdout
    help      Prints this message or the help of the given subcommand(s)
Example of subcommand dump:
alexis@MacBook-Pro % sudo env "PATH=$PATH" py-spy dump --pid 36588

Process 36588: /Users/alexis/miniforge3/bin/python /Users/alexis/PythonProfiling/main.py
Python v3.9.13 (/Users/alexis/miniforge3/bin/python3.9)

Thread 0x100FDC580 (active+gil): "MainThread"
    bubble_sorting (main.py:11)
    <module> (main.py:22)
C:\Users\alexi>py-spy dump --pid 18212
Process 18212: python  main.py
Python v3.9.12 (C:\Users\alexi\anaconda3\python.exe)

Thread 2168 (active+gil): "MainThread"
    bubble_sorting (main.py:12)
    <module> (main.py:21)
Example of subcommand top, it refreshes the information once per second:
alexis@MacBook-Pro % sudo env "PATH=$PATH" py-spy top --pid 36588

Collecting samples from '/Users/alexis/miniforge3/bin/python /Users/alexis/PythonProfiling/main.py' (python v3.9.13)
Total Samples 1200
GIL: 100.00%, Active: 100.00%, Threads: 1

  %Own   %Total  OwnTime  TotalTime  Function (filename:line)
 38.00%  38.00%    5.86s     5.86s   bubble_sorting (main.py:12)
 52.00%  52.00%    5.65s     5.65s   bubble_sorting (main.py:11)
  9.00%   9.00%   0.420s    0.420s   bubble_sorting (main.py:10)
  1.00%   1.00%   0.070s    0.070s   bubble_sorting (main.py:13)
  0.00% 100.00%   0.000s    12.00s   <module> (main.py:22)
C:\Users\alexi>py-spy top --pid 18212

Collecting samples from 'python  main.py' (python v3.9.12)
Total Samples 400
GIL: 100.00%, Active: 100.00%, Threads: 1

  %Own   %Total  OwnTime  TotalTime  Function (filename:line)
 58.00%  58.00%    2.27s     2.27s   bubble_sorting (main.py:12)
 36.00%  36.00%    1.51s     1.51s   bubble_sorting (main.py:11)
  5.00%   5.00%   0.160s    0.160s   bubble_sorting (main.py:10)
  1.00%   1.00%   0.060s    0.060s   bubble_sorting (main.py:13)
  0.00% 100.00%   0.000s     4.00s   <module> (main.py:21)
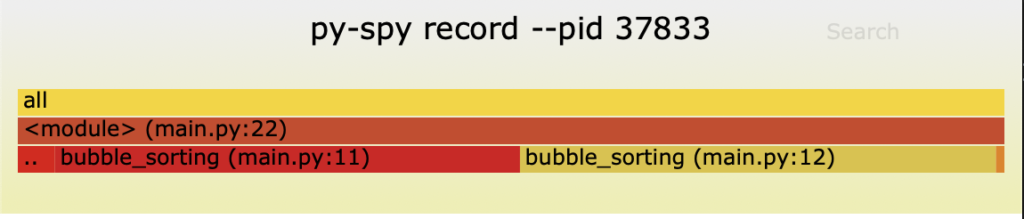
Example of subcommand record, it generates an image file with extension .svg summarizing the experiment:
alexis@MacBook-Pro % sudo env "PATH=$PATH" py-spy record --pid 36588
py-spy> Sampling process 100 times a second. Press Control-C to exit.

^C
py-spy> Stopped sampling because Control-C pressed
py-spy> Wrote flamegraph data to '36588-2022-08-06T08:00:04-05:00.svg'. Samples: 24397 Errors: 0
C:\Users\alexi>py-spy record --pid 18212 --output profile.svg
py-spy> Sampling process 100 times a second. Press Control-C to exit.


py-spy> Stopped sampling because Control-C pressed
py-spy> Wrote flamegraph data to 'profile.svg'. Samples: 603 Errors: 0
DISassembling
Understanding how the executing bytecode behaves, beyond the Python code that we have analyzed, can gives us an idea of how things work internally and why some pieces of code work better than others, and the dis module is the tool that includes the default distribution of Python that we have for this purpose.
In [1]: import dis

In [2]: import main

In [3]: dis.dis(main.bubble_sorting)
  5           0 LOAD_GLOBAL              0 (len)
              2 LOAD_FAST                0 (array)
              4 CALL_FUNCTION            1
              6 STORE_FAST               1 (n)

  7           8 LOAD_GLOBAL              1 (range)
             10 LOAD_FAST                1 (n)
             12 CALL_FUNCTION            1
             14 GET_ITER
        >>   16 FOR_ITER                96 (to 114)
             18 STORE_FAST               2 (i)

  8          20 LOAD_CONST               1 (True)
             22 STORE_FAST               3 (sorted_item)

 10          24 LOAD_GLOBAL              1 (range)
             26 LOAD_FAST                1 (n)
             28 LOAD_FAST                2 (i)
             30 BINARY_SUBTRACT
             32 LOAD_CONST               2 (1)
             34 BINARY_SUBTRACT
             36 CALL_FUNCTION            1
             38 GET_ITER
        >>   40 FOR_ITER                62 (to 104)
             42 STORE_FAST               4 (j)

 11          44 LOAD_FAST                0 (array)
             46 LOAD_FAST                4 (j)
             48 BINARY_SUBSCR
             50 LOAD_FAST                0 (array)
             52 LOAD_FAST                4 (j)
             54 LOAD_CONST               2 (1)
             56 BINARY_ADD
             58 BINARY_SUBSCR
             60 COMPARE_OP               4 (>)
             62 POP_JUMP_IF_FALSE       40

 12          64 LOAD_FAST                0 (array)
             66 LOAD_FAST                4 (j)
             68 LOAD_CONST               2 (1)
             70 BINARY_ADD
             72 BINARY_SUBSCR
             74 LOAD_FAST                0 (array)
             76 LOAD_FAST                4 (j)
             78 BINARY_SUBSCR
             80 ROT_TWO
             82 LOAD_FAST                0 (array)
             84 LOAD_FAST                4 (j)
             86 STORE_SUBSCR
             88 LOAD_FAST                0 (array)
             90 LOAD_FAST                4 (j)
             92 LOAD_CONST               2 (1)
             94 BINARY_ADD
             96 STORE_SUBSCR

 13          98 LOAD_CONST               3 (False)
            100 STORE_FAST               3 (sorted_item)
            102 JUMP_ABSOLUTE           40

 15     >>  104 LOAD_FAST                3 (sorted_item)
            106 POP_JUMP_IF_FALSE       16

 16         108 POP_TOP
            110 JUMP_ABSOLUTE          114
            112 JUMP_ABSOLUTE           16

 18     >>  114 LOAD_FAST                0 (array)
            116 RETURN_VALUE
Clearly, this output is the disassembly of the code being executed. When interpreting it we can observe the following details:
- The first column corresponds to the equivalent line number in the Python code that you are referring to.
- In the second column, only some lines contain
>>, which corresponds to the redirects and moves in the Python code. - The remaining columns correspond to the equivalent lines of the disassembled code.
Final Recommendations
The tools for profiling an application are now available, but there are several thoughts that we must take into account. Here are some recommendations:
- CPU Overclocking and BIOS-based Accelerators, as Eco Modes and Battery Optimizing, can affect the real performance of the code under testing. It is recommended to disable them.
- Telemetry Tools, Anti-Viruses, or Cloud-based File Sharing Systems should be disabled during the experiments.
- Perform several measurements to obtain valid statistics could help us to confirm the expected behavior of the changes, and confirm the hypothesis.
- Run experiments in a separated branches from the main repository, and keep the branches that reported code performance improvements
- Consider using PySpy and Pyinstrument for Web-based applications in environments where it is not possible to make changes to code.
If you think this content was helpful, consider buy me a cup of coffee. 😉☕️👉🏼